
By Gijsbert Stoet, Professor of Psychology at the University of Essex (UK)
Introduction
| Please write if you find any problem in this page. |
The Implicit Association Task (IAT) is a well known and popular reaction time (RT) test in social psychology and in applied settings (e.g., to help people understand their own unconscious bias). The researchers behind the test claim that the IAT measures a person’s bias that he or she may not be aware of.
|
In the IAT task described here, racial bias is defined as a
preference for "white" over "black" people. Such a preference is, for example,
the idea that white people are more pleasant than black people. PsyToolkit uses the terms "white" and "black" as commonly used, although other terminology might be preferable by yourself or other people. Apologies if you do not like the capitalization of lack thereof throughout, it is sort of mixed. Watch IAT creator Professor Greenwald explaining implicit bias |
One of the obvious difficulties with measuring racial prejudice is that people will not always disclose their true opinions or feelings about other racial groups. Ask someone "Are you a racist?". It is unlikely that even the most racist person will admit this. This because being racist is taboo in most polite societies.
It might be easier to get someones true opinion if the person you ask knows that he or she is anonymous (e.g., in an online survey). According to a study by Axt and colleagues (2018) and based on data from the Project Implicit itself, it seems that the best way to find out if somebody is a racist is simply asking explicitly (Axt, 2018).
| The US and UK are some of the most racially tolerant countries in the world (newspaper article with map). |
Given the difficulty to ask people directly about their racism, a test such as the IAT seems a great tool (if it is true that it does what the creators claim).
| For popularity of the IAT, just look on Google for IAT, and you will find many pages. |
The first IAT study of racial prejudice was by Greenwald and colleagues (1998) and carried out in different forms by others. For brevity, I will call this study simply "the Greenwald study".
| The claim that the IAT can measure people’s racist (or other bad attitudes) is extraordinary because it has major consequences; it is not surprising that people have criticized it. It is up to you to decide what you think of the test. For guidance, I have added many resources to help you make a start with this in the criticism secion. |
Besided the Greenwald study, one of the most cited IAT studies in regard to racial discrimination is the study by McConnell and Leibold (2001). This study was and still is influential because it was the first study claiming that those with actual racial prejudice score also score higher on the IAT. The IAT methodology and stimuli were based on the original study by Greenwald and colleagues (1998), Experiment 3. Therefore, we use the Greenwald Experiment 3 experiment here too.
The Greenwald study contains three experiments. The first is a "proof of concept" (find it also on PsyToolkit) and the second and third look at racial discrimination. The third one is the most developed one of the three and relates to the most discussion type of racial bias in US society ("black" vs "white" people).
Advertisement
Please note that the ad below is to support the PsyToolit platform. Clicking it helps us.
Above is an add. The rest below is ad free. Thank you for watching this.
How is IAT measured?
| The IAT measurement is not very intuitive or easy to follow! It can take days to get through the literature and try to understand what the score is exactly based on. This is, in part, because it is calculated differently in different studies. I have done my best to explain it as easy as possible. |
In essence, IAT is defined as a difference between two types of "blocks" in the IAT task. In one block, people are faced with an incompatible situation (from the white racist’s point of view the idea that black people are more pleasant than white people). This is called the "incompatible" block. In another block, people are faced with a compatible situation (from the white racist’s point of view the idea that white people are more pleasant than black people). The difference in response times in these two blocks is the IAT score. The higher the score, the more biased the person is.
For example:
-
In an compatible block, people need to respond with the left hand to both pleasant words (such as "diploma") and name that is typical in one’s own race (e.g., "John" for US white people).
-
In an incompatible block, people need to respond with the left hand to both pleasant words (such as "friendship") and name that is typical in another race (e.g., "Malik" for US white people).
IAT effect = incompatible correct reaction times - compatible correct reaction times
The basic idea behind the IAT is that a racist will find it "confusing" (or incompatible) to respond with the same hand to a pleasant word (such as "friendship") and to the name of the people he/she finds unpleasant.
The non-biased or non-racist person responds equally fast in compatible and incompatible blocks because the non-biased or non-racist person has no specific associations between pleasantness and race. Whether this assumption necessary makes sense is another issue (see in the criticism section).
One problem that the designers of the IAT were well aware of is that because whole blocks are compatible or incompatible, the block order can interfere with the IAT effect. That is, people who start with an incompatible block might be slower because they are still learning the task and not because they are biased/racist.
| There is an important difference between compatibility or congruence in the IAT and the Stroop task. In the IAT, the name stimuli are not compatible or incompatible per se, it is the whole block. In the Stroop task, individual stimulus (colored words) are compatible or incompatible. In the Stroop task, you do not suffer from the block order problem. |
To solve this problem, the Greenwald and colleagues (1998) study used an additional set of blocks in the opposite order. This is explained further below.
About this implementation
This is an almost exact copy of the original Experiment 3 by Greenwald and colleagues (1998). There are some differences explained below.
From the participants' point of view, the basic IAT task is to look at words on the screen (in this case, first names of black/white people and pleasant or unpleasant things).
On each trial, people need to press a LEFT or RIGHT positioned button to match the category description (in our example, we use the keys A and L, but Greenwald and colleagues used the A key and the 5 key of the numeric keypad). The latter would not work well on Laptops (which do not have a numerical keypad), hence we use L.
Note, this task uses words only, there are no pictures involved.
| If you want to do this study in your country, you would need to determine exactly which group names are associated with. The names used in this experiment are very specific for a young educated American audience in the late 1990s. Some of the names associated with African Americans are probably more common among white Europeans, such as Yvette or Yolanda, whereas others are more likely in south Asian than African European social groups, such as Aiesha. |
Stimuli
Note that these names come from the Greenwald and colleagues (1998) article, Appendix A. In the demonstration experiment, only the male names are used.
| Professor Greenwald shares all materials via this website. |
They used 25 pleasant words, namely: caress, freedom, health, love, peace, cheer, friend, heaven, loyal, pleasure, diamond, gentle, honest, lucky, rainbow, diploma, gift, honor, miracle, sunrise, family, happy, laughter, paradise, vacation.
They used 25 unpleasant words, namely: abuse, crash, filth, murder, sickness, accident, death, grief, poison, stink, assault, disaster, hatred, pollute, tragedy, bomb, divorce, jail, poverty, ugly, cancer, evil, kill, rotten, vomit.
They used 25 first names often associated with African American males: Alonzo, Jamel, Lerone, Percell, Theo, Alphonse, Jerome, Leroy, Rasaan, Torrance, Darnell, Lamar, Lionel, Rashaun, Tyree, Deion, Lamont, Malik, Terrence, Tyrone, Everol, Lavon, Marcellus, Terryl, Wardell.
They used 25 first names often associated with white American males: Adam, Chip, Harry, Josh, Roger, Alan, Frank, Ian, Justin, Ryan, Andrew, Fred, Jack, Matthew, Stephen, Brad, Greg, Jed, Paul, Todd, Brandon, Hank, Jonathan, Peter, Wilbur.
They used 25 first names often associated with African American females: Aiesha, Lashelle, Nichelle, Shereen, Temeka, Ebony, Latisha, Shaniqua, Tameisha, Teretha, Jasmine, Latonya, Shanise, Tanisha, Tia, Lakisha, Latoya, Sharise, Tashika, Yolanda, Lashandra, Malika, Shavonn, Tawanda, Yvette.
They used 25 first names often associated with White American females: Amanda, Courtney, Heather, Melanie, Sara, Amber, Crystal, Katie, Meredith, Shannon, Betsy, Donna, Kristin, Nancy, Stephanie, Bobbie-Sue, Ellen, Lauren, Peggy, Sue-Ellen, Colleen, Emily, Megan, Rachel, Wendy.
Stimulus selection within the experiment
Words were selected randomly and without replacement (independently for each subject) until the available stimuli for a task were exhausted, at which point the stimulus pool was replaced if more trials were needed. For example, in single-discrimination tasks (a) in the 25-items-per-category condition, each 50-trial block used each of the 50 stimuli for the two categories once, and (b) in the 5-items-per- category condition, each of the 10 stimuli was used five times each.
Selection of subsets of five items for the 5-items-per-category conditions was counterbalanced so that all stimuli were used equally in the experiment. For the combined tasks, stimuli were selected such that (a) for subjects assigned to 25-item categories, each of the 100 possible stimuli - 50 target-concept items and 50 evaluative items-appeared twice in a total of 200 combined-task trials, or (b) for those assigned to 5 - item categories, each of the 20 possible stimuli appeared 10 times. In all combined tasks, items for the target-concept discrimination and the attribute discrimination appeared on alternating trials.
Procedure: Block order
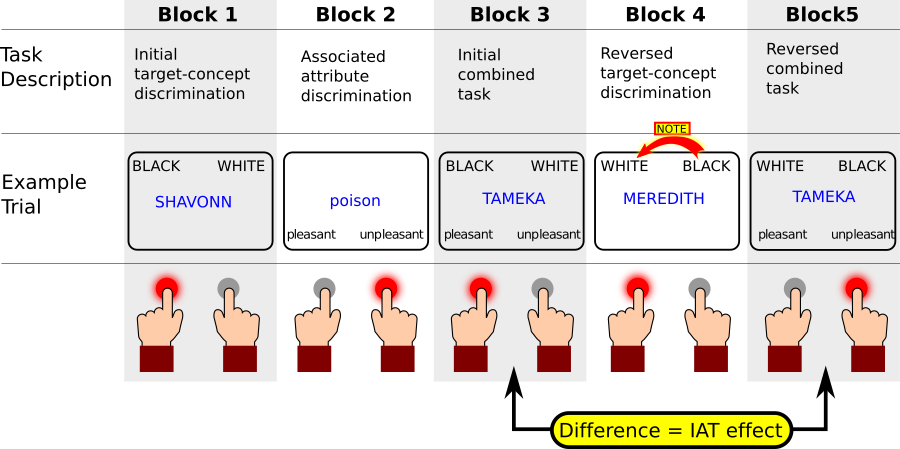
The procedure of the IAT is extremely important. There is a very specific sequence of blocks to work with. In the Greenwald and colleagues (1998) paper, this is explained in their Figure 1. Below I show this figure in my own adaptation based on that Figure (for copyright reasons, the original cannot be copied, and this one is hopefully even somewhat clearer).
| It should be noted that the Greenwald (1998) paper is not the clearest one when it comes to an exact description of the blocks used. In the original article, there are three Experiments which slightly change and they all have different ways of practicing blocks interleaved. It is a puzzle to figure it out exactly. If you want to do your own IAT experiment, you need to think of how exactly the implement it. Apparently, there are many different ways of how it can be done and possibly, it does not greatly affect the results. |
The basic task is to look at words on the screen (in this case, first names of black/white people and pleasant or unpleasant things). On each trial, people need to press a LEFT or RIGHT positioned button to match the category description (in our example, we use the keys A and L, but Greenwald and colleagues used the A key and the 5 key of the numeric keypad). The latter would not work well on Laptops (which do not have a numerical keypad), hence we use L.
The same task is done in at least nine different blocks and some additional training blocks (see below).
Here is a short explanation what happens in each block.
-
Block 1: Participant needs to decide if a name is a typically black name (e.g. Shavonn, Tameka, Ebony) or a typically white name (right button press). Here Shavonn is a typically black girl name, so participant presses left button.
-
Block 2: Participant now needs to decide if words are pleasant (left button) or unpleasant (right button) things. Here the word poison is unpleasant, so person presses right button.
-
Block 3: This is an incompatible block for white people in the US. Now the stimuli can be both names or pleasant/unpleasant things. The names are always in capitals. If it is a name, participant needs to associate according to BLACK vs WHITE, and if it a thing (small letters), they need to classify it as pleasant or unpleasant. In this case, it is a name, so they need to just decide if it is a BLACK or WHITE person’s name, and they press left button. Note that BLACK and pleasant categories are on the same side, and so are WHITE and unpleasant. The idea is people who find BLACK people unpleasant, will be distracted by the fact that they need to respond to BLACK person’s name and the pleasant things with the same response.
-
Block 4: Now the words WHITE and BLACK are swapped. People make the same decision as in Block 1 (name classification only), but now they need to learn to use opposite responses. This is only training for the following Block 5.
-
Block 5: This is a compatible block for white people in the US. As in Block 3, people will respond to both names and pleasant/unpleasant things. The only difference is that in this case, WHITE is combined with pleasant and BLACK with unpleasant. People who find black people less pleasant than white people, so the theory goes, find this easier to do than in Block 3 and respond more quickly.
In the figure above, you see there are five blocks. Blocks 1, 2, and 4 are for training the relation between the target (here in blue, a name or a pleasant/unpleasant thing) and the left or right side. For example, in Block 1, participants need to decide if names are names more common among African Americans ("black") or Caucasian Americans ("white").
For determining IAT, only blocks 3 and 5 are relevant. Given the layout of the figure above, the idea is this: In Block 3, a person responds to both Black names and pleasant things with a left key. According to the theory, a white person might be slow in pressing the left key in response to the black girls' name "TAMEKA" because the same key is also associated with the word pleasant, and because their (supposedly racially biased) brain cannot really deal with that and is slower (similar to incompatible paradigms). In contrast, for the same participant, responding the Tameka in Block 5 is easier, because the White participant might find black and unpleasant corresponding categories. Responses in Block 3 should be slower than in Block 5. Hence, the IAT effect is the difference in score between Blocks 3 and 5.
| This is not the end of the blocks. As mentioned earlier already, the order of the blocks can possibly explain the IAT. To deal with this, you need to add another set of blocks to counter this. That makes the whole set of blocks as follows. |
Note that each block always has 50 trials, but that sometimes, there are 100 stimuli; in that case, the blocks done twice (hence, 3a and 3b, 5a an 5b, etc). In Experiment 3 of the original Greenwald study, reaction times from the first two trials are not analyzed, because these are often longer (people get faster once started). In the PsyToolkit implementation, this is taken into account in the data analysis, but not for the 2003 method (because they did not mention it).
In the original study there are additional training blocks, and it is not entirely clear what they did. The idea, I suppose, is that some practical training was thought of as useful to practice for the basic classification. But then, one should ask why there was not training before the combined task either (given that they are considerably harder to do).
| Block(s) | Description |
|---|---|
1 |
In the current implementation, this is the instructions block |
2 |
Black/White classification task |
3 |
Unpleasant/Pleasant classification task |
4 |
Black/White + Unpleasant/Pleasant combined task (first of combined 1 — Black+ ) |
5 |
Black/White + Unpleasant/Pleasant combined task (second of combined 1 — Black+ ) |
6 |
White/Black classification task |
7 |
White/Black + Unpleasant/Pleasant combined task (first of combined 2 — Black- ) |
8 |
White/Black + Unpleasant/Pleasant combined task (second of combined 2 — Black- ) |
9 |
White/Black classification task |
10 |
White/Black + Unpleasant/Pleasant combined task (first of combined 3 — Black- ) |
11 |
White/Black + Unpleasant/Pleasant combined task (first of combined 3 — Black- ) |
12 |
Black/White classification task |
13 |
Black/White + Unpleasant/pleasant combined task (first of combined 4 — Black+) |
14 |
Black/White + Unpleasant/pleasant combined task (first of combined 4 — Black+) |
As noted, the term Black+ in the table above refers to the situation when black and pleasant are associated (and thus white and negative). Greenwald et al. do not use this specific term (Black+), but here it was just to abbreviate the text a bit.
| One of the problems with the binary classification (Black = Unpleasant or White = Unpleasant), you are always going to be a racist to some group (see criticism). |
| In Table 1, there are thus 13 blocks of 50 trials each, which makes 650 trials in total. |
| In the US, the terminology is different from many other countries. In the Greenwald 1998 article, they use Black to refer to what they call African Americans or Black Americans (p.1465), and use White to refer to European Americans. The exact terms used in different situations have changed over time, read more here on the Pew Research website. In Canada they use these and in the UK these. |
Also, note that this study can be carried out with male names or female names. In the study by Greenwald and colleagues (1998), they call these two "subexperiments" (one with male and one with female names). This was apparently not found to be different (see Greenwald et al., p. 1474, under IAT Effects).
Procedure: Sequence of events in one trial
In each block, there is the same sequence of effects, and here they are explained in more detail.
These are taken from the study’s Experiment 1, but changed when needed as described in their Experiment 2:
-
The first trial started 1500 ms after the reminder display appeared.
-
Stimuli were presented in black letters against the light gray screen background, vertically and horizontally centered in the display and remaining on screen until the subject’s response.
-
The subject’s keypress response initiated a delay (intertrial interval) before the next trial’s stimulus.
-
The intertrial interval was 250 ms (this was different from Experiment 1)
-
Throughout the experiment, after any incorrect response, the word error immediately replaced the stimulus for 300 ms, lengthening the intertrial interval by 300 ms.
-
At the end of each 50-trial block, subjects received a feedback summary that gave their mean response latency in milliseconds and percentage correct for the just-concluded block.
How this demo deviates from the original
This implementation is extremely similar to the original Experiment 3 as far that is possible. The original paper fails to give sufficient details about a number of issues, and that is where best guesses had to be made, here they are:
-
The exact size and font type of letters is not provided in the Greenwald paper; here we use Arial 18 points)
-
The exact position of the words is not provided, we used our common sense what seems to work.
-
The background should be light gray, we use RGB values 200,200,200
-
Greenwald and colleagues (1998) are not explicit about what happened when people did not respond quickly. No maximum response time limit for participants is given, so I assume there was none. This seems further confirmed by their the data analysis section (p.1467) and the Greenwald and colleagues (2003) article. They tried different things to analyze these data, apparently with the same results (see p.1467, right column and footnotes). Based on this, PsyToolkit actually gives maximum of 10,000 (given that Greenwald and colleagues recommend not to include these extremely slow responses). Slower responses tell people that they were too slow.
On the following this demo differs. You can change it if you wish.
-
In the original, the only message on wrong responses is "ERROR". In the PsyToolkit version, it reminds the participants whether it is a wrong key (A or L), or whether they are too slow.
-
In the original, there were additional training blocks. In PsyToolkit’s opinion, they are not necessary for a few reasons. For one, the first blocks will never be analyzed anyway (we only analyze combined blocks). By the time people do combined blocks, they will be pretty experienced. Sure, doing a combined block is more difficult that the simple blocks with only two words in the corners, but additional training is probably not necessary. If you disagree, you could add this. In the original paper it did not say explicitly how long the training blocks were, but it says that all blocks were 50 trials, so PsyToolkit assumes that the training blocks were 50 trials each, too.
-
In personal communication, Tony Greenwald recommended to PsyToolkit to use the 2003 analysis results. The difficult is a bit that in the 2003 article, fewer blocks are used.
-
The feedback at the end of the experiment is a bit more detailed and gives an idea of how prejudiced participant is. This is really useful for this learning website, but you could take out the last block called "feedback" if you do not want it.
Run the demo
| In this example, you will see words and you need to categorize. This version uses a keyboard (as in the original). Also, it uses words only (no stimulus pictures). |
This demo has 13 blocks of 50 trials each (650 trials in total) and takes 20 minutes to complete. The data output file data has in the last line three numbers: 1) The conventional IAT score, 2) The 2003 D score, and 3) the percentage of trials faster than 300 ms. At the end, you can click the "show data" button and see your scores.
| If you are not born and bred in the USA, then the black/white name classification task is meaningless. In other words, it is very much dependent on cultural knowledge. |
Data output file
| In PsyToolkit, the data output file is simply a textfile. The save line of the PsyToolkit experiment script determines what is being saved in the data output file. Typically, for each experimental trial, you would have exactly one line in your text file, and each number/word on that line gives you the information you need for your data analysis, such as the condition, response speed, and whether an error was made. |
Meaning of the columns in the output datafile. You need this information for your data analysis. Some of the information stored is redundant
| Colum | Meaning |
|---|---|
1 |
Blocknumber (sequential, but block 1 does not save data, so this starts with 2) |
2 |
Blockname |
3 |
Trial so far in block (each block starts with 1) |
4 |
Tablerow used (not really important for any further analysis) |
5 |
Central stimulus (the name or word) |
6 |
For names, 1=black, 2=white; For words, 1=pleasant, 2=unpleasant |
7 |
Stimulus category: 1=Name, 2=Word |
8 |
0) na 1) compatibleword 2) incompatible word 3) compatible name 4) incompatible name |
9 |
1) pleasant word 2) unpleasant word 3) black name 4) white name |
10 |
1: black=pleasant are both on left side, 2: white and pleasant are on same side |
11 |
Response time |
12 |
Status (1=correct, 2=wrong, 3=too slow) |
The last line of the file stores the IAT score (based on the Greenwald 2000 paper).
| For a simple data analysis, set "Only include last n lines" to 1 and set the dependent variable to 1. Then you simply get for each participant the IAT score. Most likely that is all you want. For more sophisticated analyses, I recommend to download the data for offline analysis. |
Scoring using the original 1998 article
The scoring is really hard to figure out from the paper, because the explanation of the IAT is scored is scattered all over the three experiments in the paper.
The Results and Discussion section (p.1474) and Figure 5 suggests that the IAT is calculated as the average IAT effect in blocks 7+8 - blocks 4+5 as well blocks 10+11 - blocks 13+14.
This is only for correct response times between 300 and 3000 ms. In the PsyToolkit data analysis, the standard analysis only includes data between 300 and 3000 ms.
| It is impossible to come up with anything more precise given the ambiguity in the article. |
There are two ways to use the survey analysis (set in "analyze"):
Conventional and easy analyze
Easiest is to just to extract the IAT value. In analyze, set the analysis parameters as follows:
-
Which column has dependent variable? = 1
-
Only include last n lines = 1 (make sure you do not forget this one!)
Then for each participant, you get the IAT values in the file ending on means.xlsx
Conventional and sophisticated analyze
A bit more sophisticated is to set the analysis parameters as follows. There is not much of an advantage, but this probably shows you how you can get more interesting other data out as well.
-
Which column has dependent variable? = 10
-
Which column has status (correct=1)? = 11
-
Grouping variable (column?)? = 7
-
Grouping variable (column?)? = 6
-
Exclude last n lines = 1 (make sure you do not forget this one!)
-
You can exclude RTs below 300 and above 3000
Then, you will get for each participant in the file ending on .mean.xlsx the following:
For the compatible names, you take the column 1_1 and for incompatible names you take column 2_1. You can, thus, simply subtract column C in this spreadsheet from column B
The new analyze method
Greenwald and colleagues proposed a novel method, the so called D score. I will refer to this as the 2003 method.
In the analyze section of your experiment, do the following:
-
Which column has dependent variable? = 2
-
Only include last n lines = 1 (make sure you do not forget this one!)
There is an article (Greenwald et al., 2003; especially Table 1) and a book chapter that you can read to understand this (Lane et al, 2007; especially Table 3.3). It takes detective work to find out what exactly they do, but combining Table 1 of the 2003 paper and Table 3.3 from the 2007 chapter is necessary (and recommended by Greenwald’s website).
This method takes different trials into account. Here is what is particularly different:
-
In the 1998 paper, we only took the response times for names, as this seems what is done in that paper. In the 2003 article and 2007 chapter, it is suggested to take response times to all trials. In the 1998 paper, it is never made explicit, but they suggest strongly only to take the response times to names (as they report those). Anyway, in the new method, we take all trials.
-
In the 1998 article, response times over 3,000 ms were removed, but in the new 2003 method only those over 10,000 ms are removed.
-
In the new method, we keep track of the percentage of response times below 300 ms and report that. Data (i.e., IAT scores) from participants with more than 10% of response times (also known as latencies) should be entirely rejected.
In the table below, you see the methodology step by step. Note that there are other methods around as well. This seems to be the one that Greenwald recommends based on the data of each participant individually.
| Step | What is being calculated in this step |
|---|---|
1 |
If a participant has more than 10% trials below 300 ms, ignore this participant’s data for further consideration. |
2 |
Remove all response times over 10,000 ms and remove all error trials. Use these data for the steps below. |
3 |
Combine the data from the compatible and the incompatible practice data. As you know, there are two sequential combined blocks (50 trials each) with the same layout of corner words. When we have these, we call the first one practice and the second one real. In the PsyToolkit implementation, these blocks are called combined1 and combined2. Now take the standard deviation of these data and call it SDpractice . Greenwald calls this inclusive SD. |
4 |
Now do step 3 the same way for the real data. That is take the response times from blocks combined1b and combined2b, which are blocks in which people are more practiced (hence called real or serious data). Now take the SD of these data and call it SDreal. |
5 |
Now calculate the IAT difference scores for practice blocks, that is, incompatible - compatible. We do this for the mean RT score for the block of practice incompatible data (block combined1) from that we subtract the mean RT score for the practice block of compatible data (block combined2). We call this IATpractice. |
6 |
Now we do step 5 for the real data. We do this for the mean RT score for the block of real incompatible data (block combined1b) from that we subtract the mean RT score for the real block of compatible data (block combined2b). We call this IATreal. |
7 |
Now we calculate ratio 1 by taking the result from step 5 (IATpractice) and divide it by the results from step 3 (SDpractice). |
8 |
Now like step 7, we calculate ratio 2 by taking the result from step 6 (IATreal) and divide it by the results from step 4 (SDreal). |
9 |
Finally, we thus have two ratios (from steps 7 and 8). We take the average of these two ratios, and that is the final IAT D score. |
| The IAT D score is the second value in the last line of the data file. The third value in the last line of the data file is the percentage of trials faster than 300 ms. This way, you get all the data you need for your IAT project. |
Note that in order to find what percentage of trials were faster than 300 ms, you need to run the analyze section another time as follows.
-
Which column has dependent variable? = 3
-
Only include last n lines = 1 (make sure you do not forget this one!)
You need to prepare+download the data twice (once for the IAT D variable and then the second time for the error rate).
Check out the source code
Download
| If you have a PsyToolkit account, you can upload the zipfile directly to your PsyToolkit account. |
If you want to upload the zipfile into your PsyToolkit account, make sure the file is not automatically uncompressed (some browsers, especially Mac Safari, by default uncompress zip files). Read here how to easily deal with this.
Criticism
As noted, the IAT is not without criticism. That is not surprising given the big claims behind it. While the findings are not disputed (i.e., there is an IAT effect), there is disagreement whether the observed IAT effect indicates prejudice or something else.
Criticism of the IAT theory has been expressed in academic articles and in by various academics in the popular media. Below, a short overview of these types of criticism are listed.
PsyToolkit’s opinion about IAT
-
One specific criticism against this (Greenwald 1998) paper is that it is hard to follow the methodology! The descriptions in the Greenwald article are spread out over three different experiments, and other resources are not much clearer. It takes a lot of puzzling to figure out how exactly the IAT score in the 1998 article are calculated ("the conventional method"). Yes, the basic idea is simple, but there are lots of details that you need to understand in order to implement the task correctly. For example, it is not immediately clear if you should only take the RTs for names, or for all words (which technically makes equally much sense).
-
It becomes even harder with the new algorithm (2003) and the different possible block sequences. I have done my best to simplify it here, but it took me hours and hours to understand, in part because the IAT papers are such puzzles.
-
The IAT claims to be about implicit or unconscious bias, but the task is actually pretty explicit. When you combine a race with a word such as pleasant or unpleasant, people might well be aware of what the task is after.
-
In many ways, the IAT is a nice task. Intuitively, the theory might be appealing. I mean, does it not make sense that particularly racists would find it difficult to respond with the same hand to a pleasant word as a hated racial name? And, indeed, the task is relatively easy to do for participants (although the implementation of this specific Experiment 3 from the Greenwald study has, in my opinion, too many trials).
-
I can appreciate the controversy about the task. Claiming that someone is racist is extraordinary. Extraordinary claims require extraordinary evidence — I am not convinced we have that here, especially given that even black people themselves seem to be biased against black names and given that the task is not very predictive of actual behavior.
-
The block order of Greenwald’s Experiment 3 does not make much sense to me. I understand that block order is a problem given that people are faster in the beginning of a task. But the block order in Experiment 3 of the Greenwald paper is weird. For example, why do we need another training block (block 13 in Greenwald’s figure 5)? Also, is it not possible that 10-11 (as in Figure 5) and 15-16 are much better trained than blocks 6-7 and 19-20?
Academic research disagreeing with IAT
-
APA Feature article summarizes various critical points.
-
The Brauer Lab group of Wisconsin University criticized the IAT in an overview with references; this mentions the poor test-retest reliability, the lack of training induced shifts in IAT scores, and the lack of predictive validity (i.e., that people with a IAT bias score are actually biased in real-world situations).
-
Blanton and colleagues (2009) reviewed the race-specific IAT findings and concluded it does not stand up to scrutiny (I am sure not all agreed on this, if you are interested, maybe you can find a response to this article by IAT proponents).
IAT in the popular media
The IAT is one of the most discussed psychological tests in the media. Of course, there are few other topics as hotly discussed in the last two decades as racism and prejudice (can you think of other social issues that are equally hotly discussed — which ones?). What do you think about the various news stories and interviews you can view below (some are positive about IAT and some are negative).
| When things are discussed in the media or YouTube, they often lack clear references and you need to believe people just because they say so. The links below are given for context and you need to use your own critical thinking to process what is being said. What people say is not necessarily true (or false), it is just less filtered and not backed up by clear evidence. |
Positive about IAT in media
Negative about IAT in media
I could find several sources on YouTube of arguments against the IAT. You might find these helpful or not helpful at all. Sometimes, it is nice to have a quick look at such videos to get a sense of the arguments; in order to really understand them, you need to dig deeper.
The arguments are mostly that the IAT can be explained by novelty. The argument is that because certain names are less common, they might lead to bias. I am not sure this argument can explain other types of IAT findings, but it would possibly be relevant for the current highly cited Experiment 3 of the Greenwald study.
Michael Shermer is a well known science writer and has studied psychology and history of science and worked as an academic. He is well known for his skeptical view on many different issues and appeared many times in the media. He has also critically reviewed IAT, as you can watch here.
Craig Harper is an academic at Nottingham Trent University (UK) and made a nice critical video (8 minutes) from his teaching of the IAT (filmed in class), which you can find here.
|
As with most YouTube interviews, these latter videos lack
full references for what is being claimed; after all, it is YouTube.
As a university student or academic, you must look at the original academic debate underlying these points. Academic links to some of the criticism can be found here. |
Further reading
Articles
-
Axt, J.R. (2018). The Best Way to Measure Explicit Racial Attitudes Is to Ask About Them. Social Psychological and Personality Science, 9(8), 896-906. doi:10.1177/1948550617728995
-
Azar, B. (2008). IAT: Fad or fabulous. Monitor on Psychology, 39(7), p.44. Open access APA publication.
-
Blanton, H., Jaccard, J., Klick, J., Mellers, B., Mitchell, G., & Tetlock, P. E. (2009). Strong claims and weak evidence: Reassessing the predictive validity of the IAT. Journal of Applied Psychology, 94(3), 567–582. DOI link.
-
Greenwald, A.G., McGhee,D.E., & Schwartz, J.L.K. (1998). Measuring Individual Differences in Implicit Cognition: The Implicit Association Test. Journal of Personality and Social Psychology, 74, 1464-1480.
-
Greenwald, A.G., Nosek, B.A., & Banaji, M.R. (2003). Understanding and Using the Implicit Association Test: I. An Improved Scoring Algorithm. Attitudes and Social Cognition, 85(2), 197-216.
-
McConnell, A. R., & Leibold, J. M. (2001). Relations among the Implicit Association Test, discriminatory behavior, and explicit measures of racial attitudes. Journal of Experimental Social Psychology, 37, 435– 442.
-
Richetin, J., Costantini, G., Perugini, M., & Schönbrodt, F. (2015) Should We Stop Looking for a Better Scoring Algorithm for Handling Implicit Association Test Data? Test of the Role of Errors, Extreme Latencies Treatment, Scoring Formula, and Practice Trials on Reliability and Validity. PLoS ONE, 10(6), e0129601. Free download via PLOS ONE.
Useful material
-
Overview of the algorithm via Greenwald’s website (download PDF)